Video Dashboard
The Dashboard in VideoProtects® provides a snapshot of fleet Video Event activity, helping users monitor Driver Performance and Event Trends. Users can adjust the date range to view data, then review 3 main sections: the Event Status Queue (showing Event Progress Stages), Event Scores (summarizing Driver behavior through Scoring Trends), and Event Statistics (ranking Event Types by Driver). Clicking on data tiles allows deeper review in the Video Events page, and percentage changes highlight Performance shifts compared to previous periods. This tool helps managers quickly assess fleet risk, track Driver responses, and identify opportunities for coaching.
The Dashboard displays a summary of all your fleet’s event activities for the last 30 days. Access the Dashboard by clicking on the Dashboard tab in the lefthand menu.

By default, data displays from the last 30 days. Use the calendar selector located in the top right to choose a different date range to display data for.

Event Status Queue
The Event Status Queue displays the total number of events in each of the process steps for the last 30 days, or within the timeframe chosen.
Clicking on the tiles takes you to the Video Events page to see those specific video events in more detail.

What do the statuses mean?
- New: A video event that has not been watched or shared.
- In Progress: A video event that has been watched by at least one user.
- Sent to Driver: A video event that has been shared and not accepted or disputed yet.
- Driver Accepted: A video event that has been shared and accepted by recipient.
- Driver Disputed: A video event that has been shared and disputed by recipient.
- No Response: A video event that has been shared and recipient has not responded in 12+ hours.
Event Scores
The Event Scores section provides a breakdown of each score value from (-4) to positive values. This provides an overview of how the fleet is managing risky driver behavior and can help show opportunities for coaching.

*Dismissed events not included in these statistics
How are event scores calculated?
Event score percentages are calculated using the score applied to each event over the time period selected above. Percentages in grey, green, or red indicate the % change from the previous time period.
Example: Last 7 days compared to the 7 days before that period. If N/A, then we didn't find a previous time period equal to the number of days selected in the time range above.
Event Statistics
The Event Statistics section displays the event type occurrences ranked by driver of that event type.
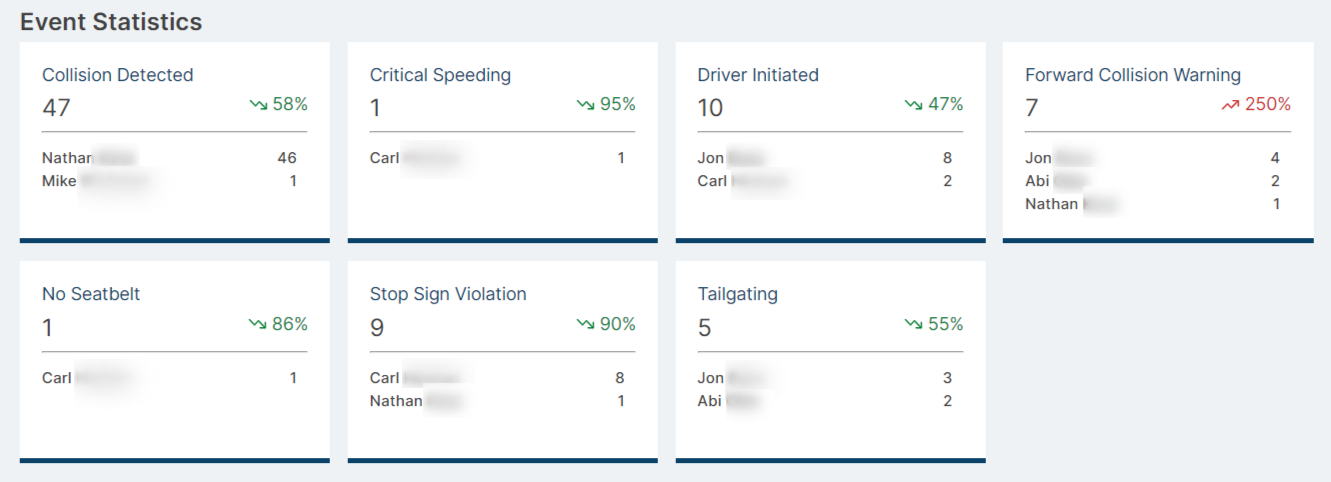
*Dismissed events not included in these statistics
How are event statistics calculated?
Event statistic percentages are calculated using the number of each event generated over the time period selected above. Percentages in green or red indicate the % change from the previous time period selected. Dismissed events are not included.
Example: Last 7 days compared to the 7 days before that period. If N/A, then we didn't find a previous time period equal to the number of days selected in the time range above.