Encompass Video Dashboard
The Video Dashboard in Encompass provides an overview of fleet Video Event activity, with data defaulting to the past 30 days (up to 90 days selectable). It includes key sections such as the Video Status Queue (Event Processing Stages), Events by Event Score (Scored Event Distribution and Trends), Driver Ranking (Performance Rankings based on Scored Events), and Event Type Statistics Queue (Event Breakdown by Type). Dismissed Events are excluded from all statistics. If Events appear under “Unknown Driver,” users can update Driver information manually in the Video Event Details page to ensure accurate reporting.
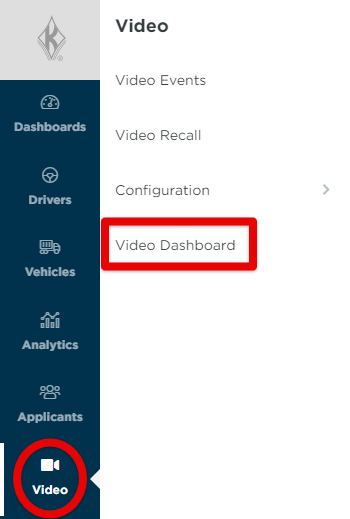
Access the Dashboard by going to Video > Video Dashboard.
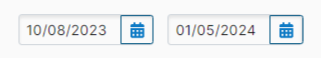
The dashboard defaults to display data from the last 30 days. To change the date range, select different dates using the calendars at the top of the page. (A maximum of 90 days can be selected as the date range from the start to end date.)
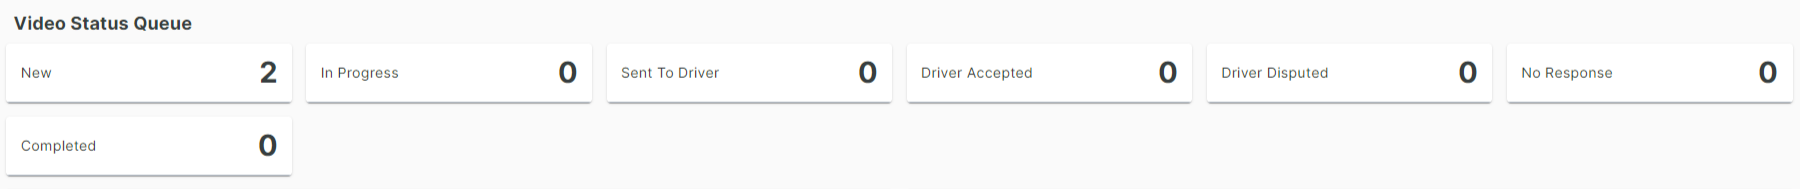
Video Status Queue
The Video Status Queue displays the total number of events in each of the process steps for the selected time period. Clicking on a status "tile" will open the Video Events page, pre-filtered to the events in that status that occurred within the timeframe indicated on the Video Dashboard.
Events by Event Score
The Events by Event Score summary shows a circle chart with a legend of how all events were scored for the last 30 days. Event score percentages are calculated using the score applied to each event over the selected time period. Percentages in grey, green, or red indicate the % change from the previous time period for that score. (ie. Last 7 days compared to the 7 days before that period.) If N/A, then the system didn’t find a previous time period equal to the number of days selected in the time range above.
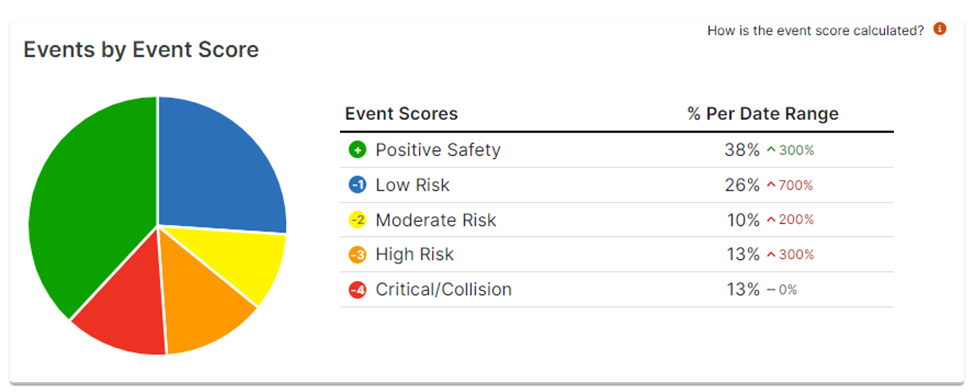
*Dismissed events are not included in these statistics
Driver Ranking
The Driver Ranking summary shows the ranking of the drivers for the selected time period. A driver’s rank is determined by the scored events over the selected time period. Scores are added and/or deducted from the driver’s initial score of 99 to derive their score and place in the driver ranking for the time period selected.
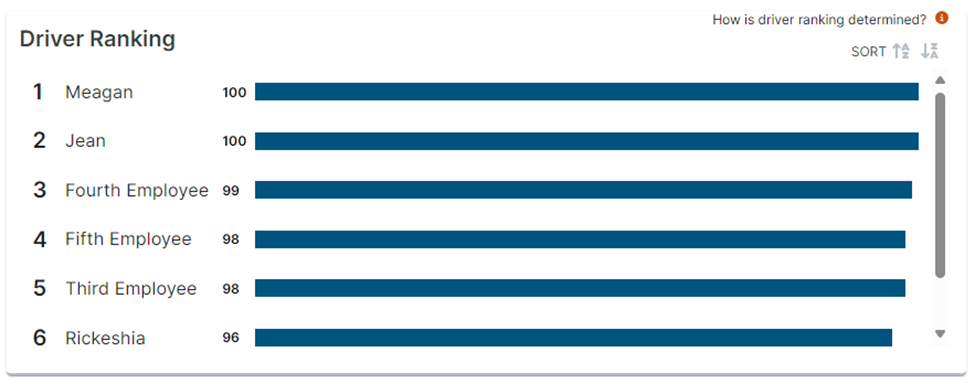
*Dismissed events are not included in these statistics
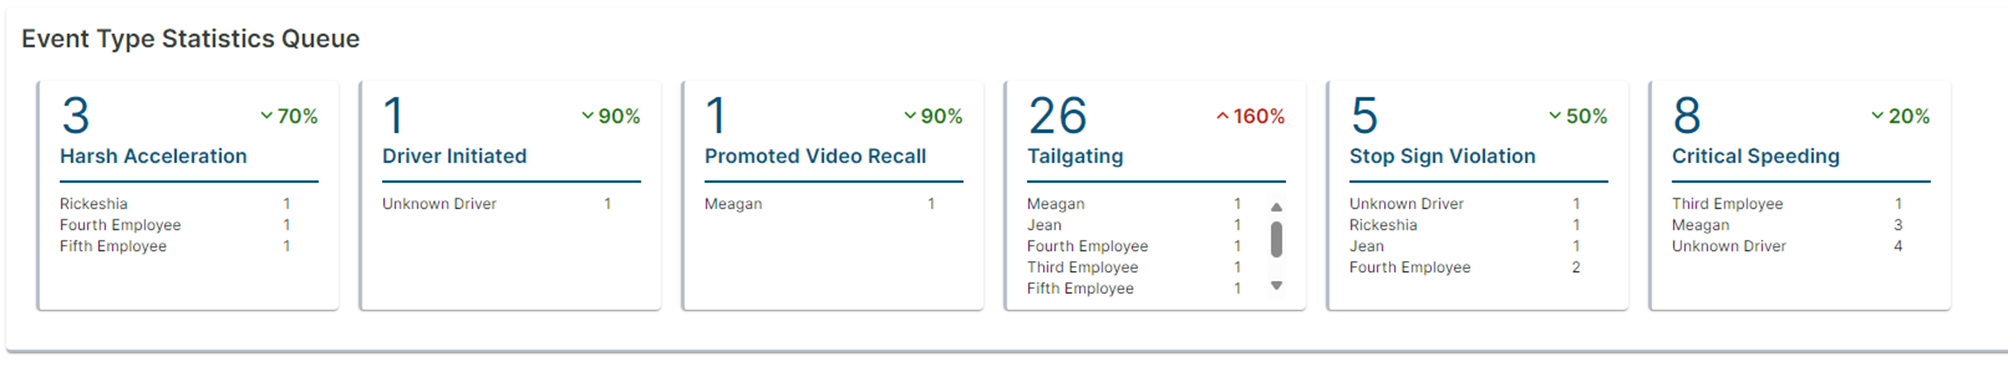
Event Type Statistics Queue
The Driver Ranking summary shows the ranking of the drivers for the selected time period. A driver’s rank is determined by the scored events over the selected time period. Scores are added and/or deducted from the driver’s initial score of 99 to derive their score and place in the driver ranking for the time period selected.
*Dismissed events are not included in these statistics
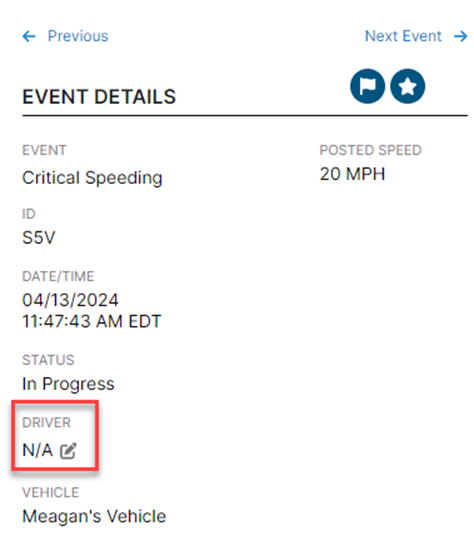
Why is the Dashboard showing "Unknown Driver?"
Events that do not have a driver assigned will be displayed as “Unknown Driver” in the Driver Ranking and Event Type Statistics Queue sections of the Dashboard. Manually updating the Driver field for an event on the Video Event Details page by clicking the pencil icon will update the driver data on the Dashboard to be reflected under that driver.