VideoProtects: Video Dashboard
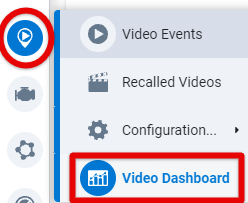
The Video Dashboard displays a summary of all your fleet’s event activities for the last 30 days. Access the Dashboard by clicking on the Video Dashboard tab in the VideoProtects menu of options.
Event Status Queue
The Event Status Queue displays the total number of events in each of the process steps for the last 30 days.

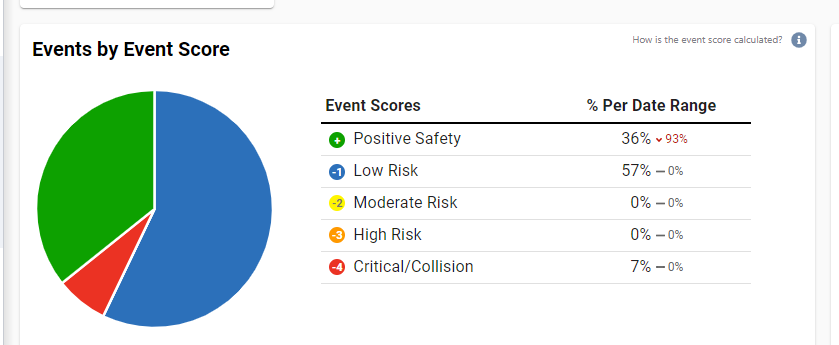
Events by Event Score
The Events by Event Score summary shows a pie chart with a legend of all events that were scored for the last 30 days.
Event score percentages are calculated using the score applied to each event over the time period selected above. Percentages in grey, green, or red indicate the % change from the previous time period. IE: Last 7 days compared to the 7 days before that period. If N/A, then we didn’t find a previous time period equal to the number of days selected in the time range above.
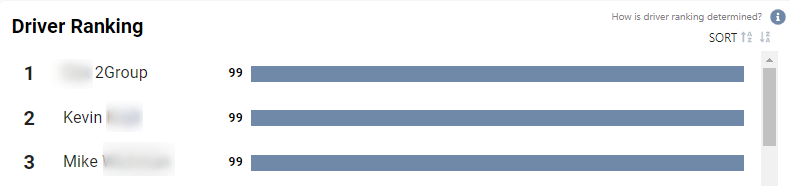
Driver Rankings
The Driver Ranking summary shows the ranking of the drivers for the last 30 days. A driver’s rank is determined by the scored events over the time period selected above. Scores are added and/or deducted from the driver’s initial score of 99 to derive their score and place in the driver ranking for the time period selected.
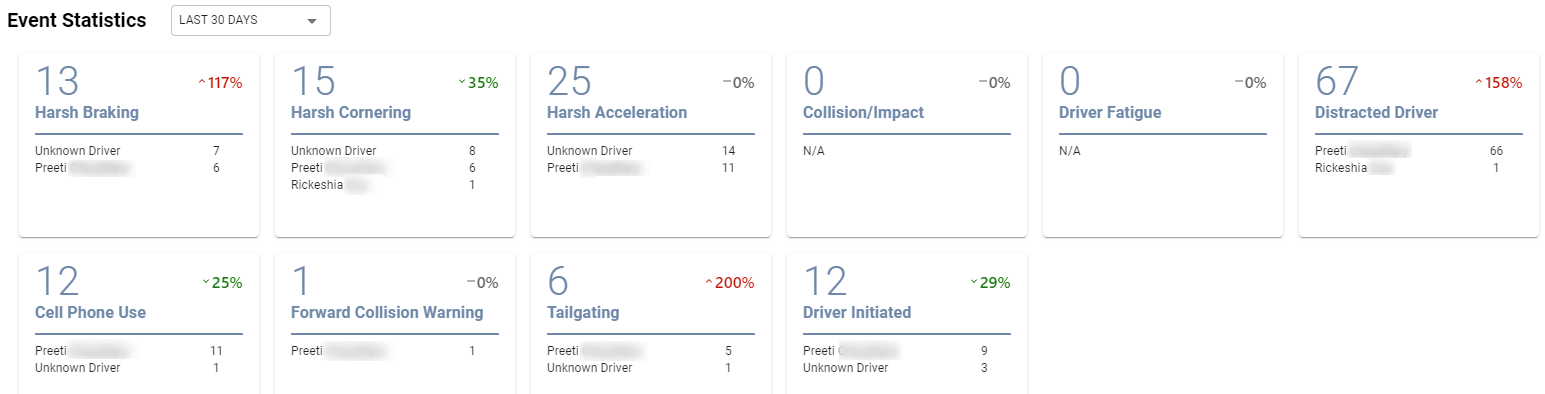
Event Statistics
The Event Statistics section displays the event type occurrences ranked by driver of that event type. Note: You can select to view a specific time range by using the dropdown next to Event Statistics. The default time range is set to 30 days.